
Reports
Dashboard and charts
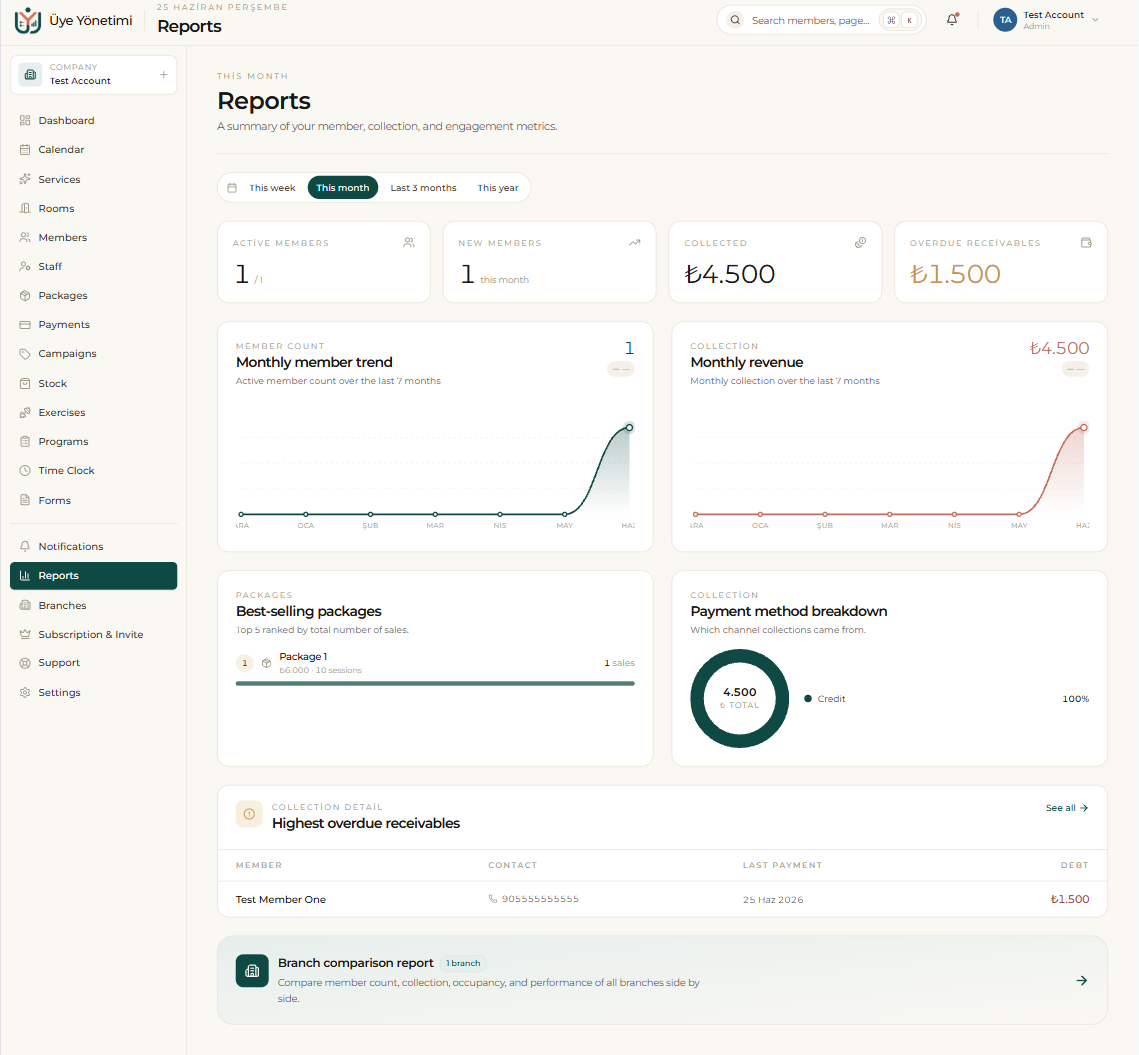
The reports dashboard keeps your business’s pulse on a single screen. For the period you choose, metrics such as monthly revenue, the new-member trend, best-selling packages and the payment-method breakdown are shown with charts.
By changing the period (this month, last 3 months, this year) you compare trends and clearly see how things are going versus last month or last year.
Receivables, branches and live data
With the overdue receivables report you see risky accounts, and with the branch comparison report you see which location runs more efficiently.
All figures come from the live data you enter; without keeping a separate spreadsheet, the reports are up to date at all times.
Step by step
- 1 Open the “Reports” page from the left menu.
- 2 Pick the period at the top: this week, this month, last 3 months or this year.
- 3 Review the monthly revenue, new-member trend, best-selling packages and payment-method breakdown charts.
- 4 From the overdue receivables section, see risky/indebted accounts and send a reminder.
- 5 If you have more than one branch, compare performance with the branch comparison report.